Are you interested in algorithmic trading strategies? Read about algo trading definition, benefits, and disadvantages. Find out if it is profitable and legal.
What is trading with the trend? The markets don't typically move straight up or down but instead make noise. Bouncing up and down between previous support and resistance zones. One of the most common strategies to profit from big moves in the market is to trade the trend. Trading with the trend means the trader identifies an established trend. Also he executes a position, or a series of positions, in the trend’s direction. This is in the expectation that the trend will continue.
Once a trader identifies the trend, either by eyeballing the price action or with one of the more common trend indicators, he then needs to find a good setup to open his position. There are many trend trading strategies, but let’s start with the most essential trend trading strategy.
Trends are made up of impulse moves and pullbacks, also called retracements. At some point after a big move, the counter-trend traders enter the market to push the price back to some median level. One of the signs that the move against the trend is only a retracement and not the end of the trend is volume. When the volume is low on the pullback, it’s an indication that the trend is likely to continue.
Let’s take a look at a basic pullback in a trend:
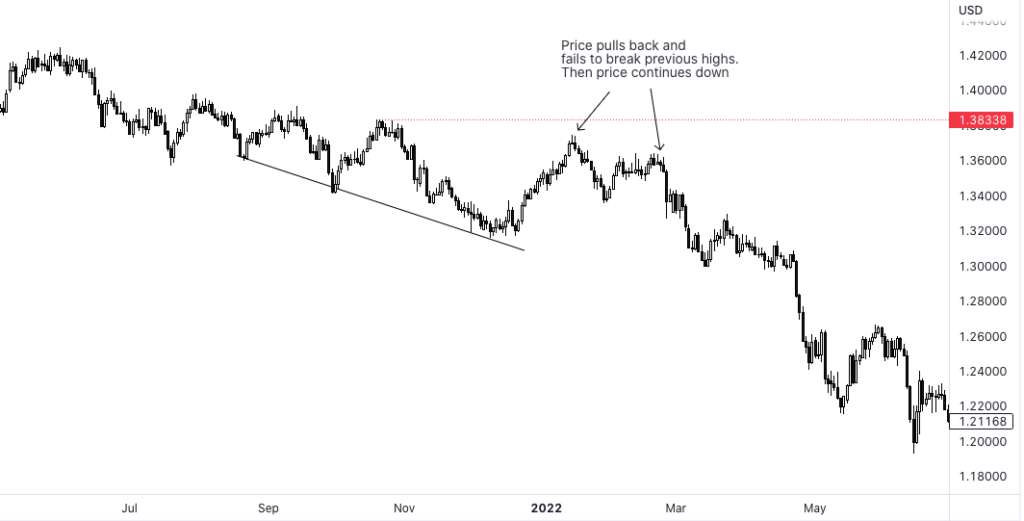
Initially, traders love to trade the breakout. They identify the trend and the consolidation. Then when the price breaks out passing the most recent high or low, they enter the market in hopes of a continuation of the trend. The general consensus of experienced traders is that although breakouts tend to make big winners, their probability is low. Most breakouts fail. The safe trade is to wait for the retracement to peter out and ride the price back to the most recent high/low, but not necessarily past it.
Let’s examine two price action trend trading strategies:
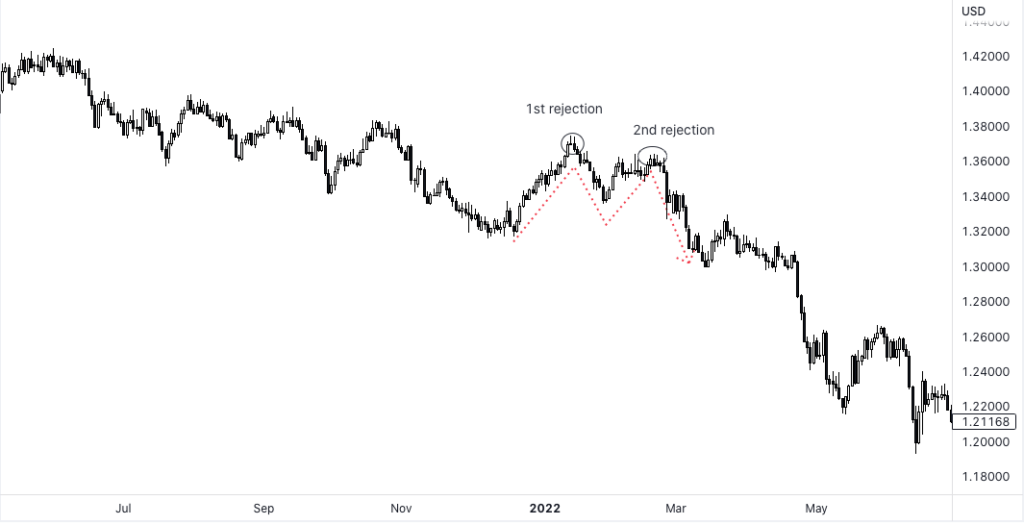
When price pulls back slightly and gets rejected, that’s already a sign of the trend continuing. If the price pulls back a second time and gets rejected, it’s even safer to assume that the trend will continue.
In a downtrend the two pullback rejections will make a double top (which looks like an M) and in an uptrend the two pullback rejections are called a double bottom (which looks like a W).
Notice the same GBP/USD daily chart from earlier where the price was downtrending and then rejected twice, making a double top (or an M) before continuing down.
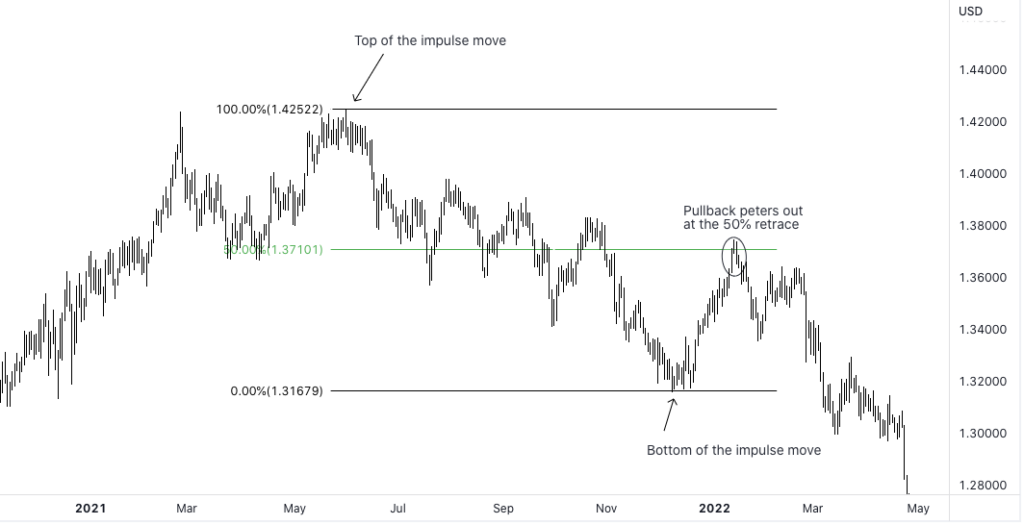
Another way to determine the end of the pullback and the continuation of the trend is by using the Fibonnaci indicator. This indicator measures the distance between the beginning of the move and the end of the move. It then plots specific measurements that the market often retraces to, such as a retracement of 38.2% or 50% or 61.8%.
Back to the same chart magnified and we see that the Fibonnaci indicates a pullback to the 50% retracement mark and then continues to decline.
In this article we learned how to identify a trend and a few trend trading strategies, but another important factor is waiting for a confirmation candle or set of candles as your setup. This will give you a better sniper position when you execute.
Good luck with your trading!
Are you interested in algorithmic trading strategies? Read about algo trading definition, benefits, and disadvantages. Find out if it is profitable and legal.
Do you want to try carry trade? Check out how it works. Carry trade strategy example and possible risks on the FX2 Blog. Take advantage of interest rate differential.
Explore our tips on swing trading in Forex. Check out swing trading strategy from our experts. Difference between scalping, day trading, and swing trading on the FX2 Blog.
What is position trading? Positional trading strategies and tips from FX2 experts. Check out indicators for positional trading.
Our FX2 experts explain the concept of demand and supply. Supply and demand charts, zones, and rules. Check out how to find and trade supply and demand zones.
What is RSI? Read about relative strength index settings and RSI in Forex trading. Discover RSI trading strategies on the FX2 Blog.
Are you looking for an easy trading strategy? Explore a simple price action strategy! Read about the horizontal support and resistance level on the FX2 Blog.