Read about using fractal indicator in trading. Our experts explained a possible fractal trading strategy for your best outcomes. Learn how to trade with fractals on the FX2 Blog.
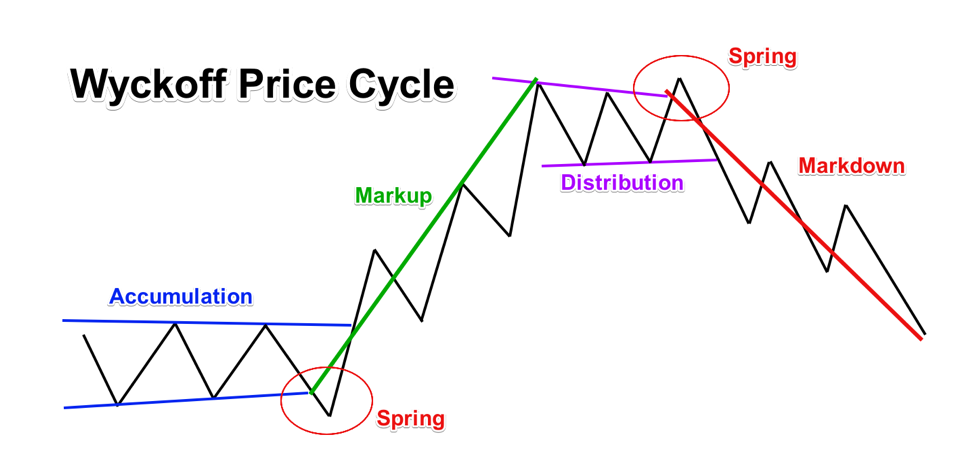
Price action in the financial markets does not occur randomly. Instead, it appears in a structured manner involving distinct cyclical patterns and phases. The way the stages occur provides valuable insights into prevailing sentiments and how the price is likely to move. The Wyckoff theory clearly outlines how the prices of stocks, currencies and other instruments move.
Developed by legendary technician Richard Wyckoff, the Wyckoff theory assumes price action follows four distinct phases:
In addition to the different cyclical stages, Wyckoff also stipulated two rules that guide price action in the different stages. First, according to the legendary trader, the market never behaves similarly. The market is unique and will never repeat the same moves it did in the past. Secondly, while every price move is unique, its analytical importance is only essential compared to previous price behavior.
The accumulation phase is the first phase in the Wyckoff method characterized by increased demand for a given security or instrument. It typically occurs when the price has fallen significantly to a point where an asset appears to have sold too much. Consequently, bulls start accumulating positions as they begin to take advantage of extremely low prices.
While accumulation is characterized by the bulls winning the battle of supremacy against the bears, price action tends to remain flat, struggling to make any new highs. In this case, the price oscillates in a range making lower highs but no new highs.
Even as price remains range bound, the higher bottoms signal the building up of buying pressure affirming the accumulation phase.
The chart shows the accumulation phase with two lower bottoms. The lower tops signal bulls are struggling to push prices higher. Before the price breaks out of the accumulation phase, it is common for the price to dip below the support level first. The flip below the support level amounts to a false breakout, giving bulls another reason to buy low. What follows is the price breaking out of the channel to the upside.
The second phase of the Wyckoff theory is characterized by price breaking out to the upside. The stage occurs as bulls gain enough power and control to steer the price above the strong resistance level in the accumulation phase.
Price breaking out of the upper level of the range on huge volume affirms bulls are in control and poised to steer price to new heights.
The distribution phase occurs after the price has increased significantly as bears flock to the market and attempt to regain control. As a result, the price action on the chart appears flat, with the price trading in a range. Lower tops and flat bottoms generally characterize the range.
Before the price breaks out of the range in the distribution phase, it is common for it to power through the descending resistance level at the top. The false breakout at the top offers short sellers another opportunity to sell high.
The price plunged from the resistance level and breached the support level at the bottom, paving the way for the next phase.
The fourth and last stage of the Wyckoff theory occurs as bears overpower bulls and steer prices below the support level of the Distribution phase. Finally, the phase appears as a strong downtrend after it breaks the lower level of the flat range.
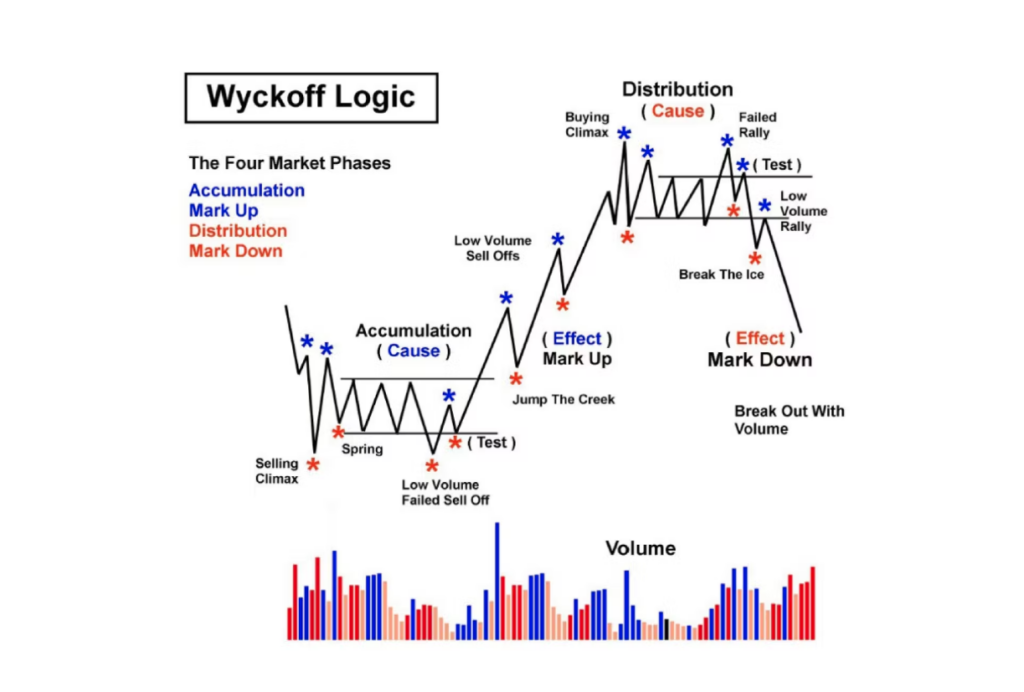
The Wyckoff trading strategy calls for increased focus on volume levels at the different phases of price cycles. This is because volume levels help shed more light on what is happening behind the scenes. In addition, heightened volume levels often lead to solid price moves from the accumulation phase to the markup phase and from the distribution phase to the markdown phase.
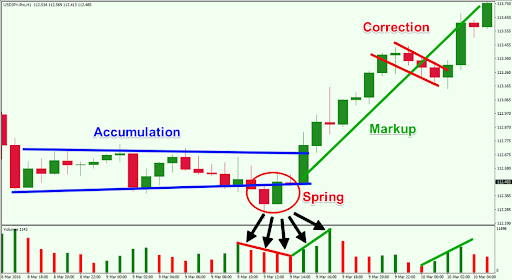
The chart clearly shows that volume levels are increasing in the first two bottoms, affirming the accumulation phase. It implies that as soon as the price dropped, more buyers entered the market and placed buy positions, thus fueling the bounce back.
Nevertheless, as the price breaks down to the lower level of the blue line, the volume levels decrease. The decline in volume levels amid the breakouts affirms a false breakout. The formation of a bullish engulfing candlestick below the support level proves bulls have overpowered bears and are poised to push prices higher.
What follows is the price edging higher with the formation of big bullish candlesticks. The fact that the breakout above the resistance level at the top occurs on high volumes confirms the start of the markup phase.
The trading Wyckoff method offers an edge in recognizing upcoming price moves. For instance, the strategy has guidelines that make it easy to know the end of the accumulation stage and the beginning of the markup stage. This provides an opportunity to profit from solid prices moving to the upside.
Likewise, the Wyckoff strategy makes it easy to know the end of the distribution phase and the beginning of the markdown, thus preparing to profit from solid price moves to the downside.
While looking to profit from the Wyckoff trading strategy, it is essential to first understand the market stage. In case of an accumulation phase, the market should be range bound, not making new higher highs or lower lows.
Instead, the price should be flat at the top and increased at the bottom. While the price moves in the range, there should be a volume increase whenever the price plunges to the lowest level of the range or support. The ideal entry level occurs when the price breaks above the flat upper level after accumulation.
The breakout occurring in high volume affirms buyers have overpowered bears and are well poised to fuel higher highs in the market.
In the chart above, price accumulation occurs as the price oscillates within the range. In the latter stages of the phase, the price drops as volume also drops. Price drops below the lowest or support level on low volume and immediately bounces back on high volume.
Price breaking above the resistance or flat top level affirms a price break out from the accumulation phase. Opening a trade at this level allows one to ride the markup phase as the uptrend is starting.
A stop loss order is vital as part of risk management. Conversely, a stop loss order can be placed a few pips below the lowest level. The risk of incurring losses if price reverses course and plunging below the accumulation phase will be avoided.
The profit take level would be when the price starts transitioning from the markup phase to the distribution phase. The early warning sign would be the price struggling to make higher highs with each push to the upside. The formation of a descending top signifies waning upward momentum signaling the start of the distribution phase. Therefore, this would be the best time to exit.
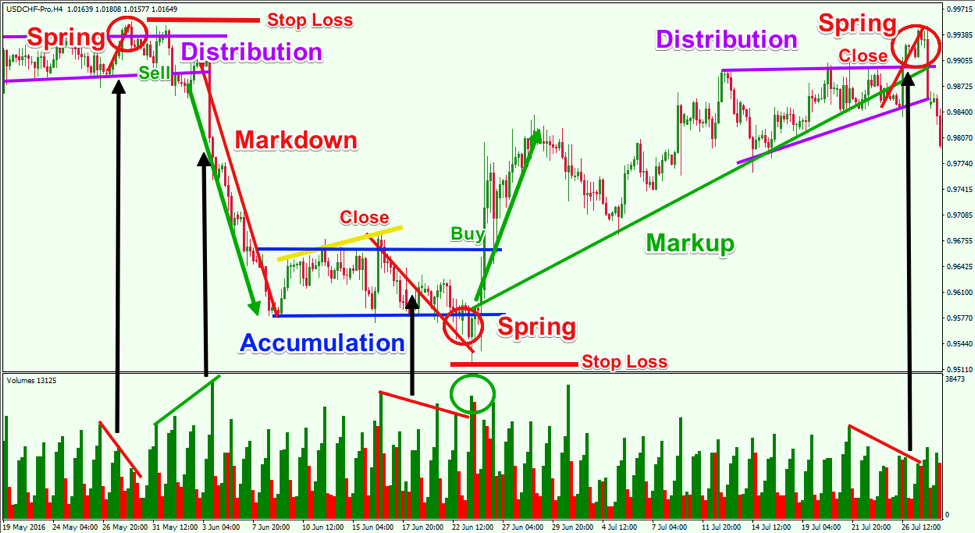
The ideal opportunity to enter a short position is when the market or security is in the distribution phase. It occurs when the price struggles to make higher highs with each push to the upside. The formation of lower tops with flat bottoms affirms the distribution phase.
If the price tries to break out to the top but faces strong opposition depicted by substantial volume that pushes the price lower, it signals a build-up in selling pressure as part of the distribution phase. Once the price breaks out of the support level on high volume, it affirms the end of the distribution phase and the start of the markup phase.
Consequently, one can open a sell position as soon as the price breaks below the support level on high volume. A stop loss can be placed a few pips above the highest level.
The Wyckoff method is a crucial trading strategy that allows traders to predict price action based on the prevailing phase. While working on the Wyckoff forex strategy, it is vital to watch volume levels as they provide valuable insights into whether bulls or bears are in control. A decisive breakout from the range on high volume suggests the breakout will hold.
Read about using fractal indicator in trading. Our experts explained a possible fractal trading strategy for your best outcomes. Learn how to trade with fractals on the FX2 Blog.
Are you thinking about using the breakout strategy? Check out tips on breakouts trading from our experts on FX2 Blog. Read about false breakouts and build your winning strategy.
Read about news impact on Forex. How to understand forex news? Explore how to trade the news in Forex market: trading strategy from our experts on the FX2 Blog.
What is a stop-loss and how to use it? How to determine stop-loss and where to set it? Difference between the stop loss and stop limit on the FX2 Blog.
Read about emotions in trading and check out how can you master your trading psychology. Build your trading confidence with our tips on trading psychology.
Check out the best indicators for swing trading in our article and trade with maximum profits. Top technical indicators for swing trading on the FX2 Blog.
Indicators and tools that forex traders use to identify the direction of the trend. Read how to determine whether a currency pair is in a trending market on the FX2 Blog.
Day trading with $1000: how to start day trading with 1000 dollars, tips on how not to lose, and how much can you make. Strategy for small day traders on the FX2 Blog.
What is range trading? How to identify the range? What range trading strategy to choose? Find the answers to these questions on the FX2 Blog.
How to be a successful scalper? Check out our scalping tips and techniques. Read our Do's and Dont's and scalp successfully with FX2 Funding.